Observability & Site Reliability
Full visibility into every service. SLOs that hold. Incidents resolved before users notice.
Cloud monitoring services that give you full-stack observability: metrics, logs, traces and SLOs unified in a single pane across AWS, Azure, GCP and OCI. We implement OpenTelemetry instrumentation, Prometheus and Grafana dashboards, distributed tracing, and SRE practices that eliminate alert fatigue and reduce mean time to recovery.
What We Deliver
Core Capabilities
- Full-Stack Observability Stack (Prometheus, Grafana, OpenTelemetry)
- Distributed Tracing (Jaeger, Tempo, Zipkin)
- Log Aggregation & Management (ELK, Loki, Fluentd)
- SLO & SLI Definition with Error Budget Governance
- Incident Management & On-Call Runbook Automation
- AIOps Alert Correlation & Noise Reduction
Ready to get started?
Get a free technical brief — architecture options, timelines, and cost estimates delivered within 48 hours. No commitment required.
- 01Submit your challenge≈ 1 min
- 02Receive your Technical BriefWithin 48h
- 03Discovery call — no obligationOptional
Or call us: +1 (929) 588-8364
By the Numbers
What clients achieve with GYSP
SLO-driven incident response with automated runbooks and distributed tracing cuts time from alert to resolution
SLI and error budget governance gives teams a data-driven mechanism to balance reliability and delivery velocity
AIOps correlation and SLO-based alerting eliminates low-signal alerts so on-call engineers act, not acknowledge
Proven Results
Observability Case Studies
 Enterprise Technology
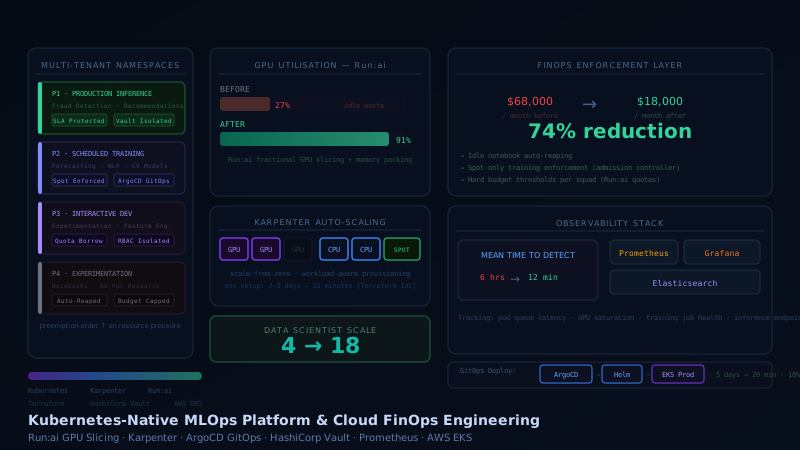
Global Enterprise AI Platform
A global enterprise AI platform operating ML workloads across recommendation engines, demand forecasting systems, and fraud detection pipelines needed to scale from 4 to 18 data scientists without GPU spend spiralling out of control. GYSP engineered a Kubernetes-native, multi-tenant MLOps platform with Run:ai fractional GPU virtualisation, Karpenter dynamic compute provisioning, and a full FinOps enforcement layer that cut monthly GPU infrastructure spend from $68,000 to $18,000 while driving average GPU utilisation from 27% to 91%.
 TravelTech
Expedia India
Manual deployments, peak-season exposure, and reactive monitoring, at the scale of millions of daily travel bookings. The infrastructure needed to match the ambition.
 EdTech
Lead School
When exam season hits, millions of students can't wait for infrastructure to catch up. Lead School needed surge-proof, compliant, fully automated infrastructure across thousands of schools.
FAQs
Common questions
Everything buyers typically ask before starting a observability engagement.
Ask us anythingWhat do cloud monitoring services include?
Cloud monitoring services include full-stack observability instrumentation (metrics, logs and traces), Prometheus and Grafana dashboard setup, OpenTelemetry SDK integration, distributed tracing with Jaeger or Tempo, log aggregation and management, SLO and SLI definition with error budget tracking, and AIOps-driven alert correlation to eliminate noise. We cover all major clouds: AWS CloudWatch, Azure Monitor, Google Cloud Operations, alongside open-source tooling.
What is the difference between monitoring and observability?
Monitoring tells you when something is wrong: a threshold is breached, a check fails. Observability tells you why it went wrong. An observable system gives you correlated metrics, structured logs and distributed traces so you can answer novel questions about production behaviour without deploying new instrumentation. Monitoring is a subset of observability: you need both, in that order.
What is SRE and how does it differ from DevOps?
Site Reliability Engineering (SRE) is Google's approach to operating production systems at scale. Where DevOps focuses on collaboration and delivery velocity, SRE introduces engineering rigour to reliability: SLOs that define acceptable targets, error budgets that govern when teams ship versus stabilise, and toil-reduction automation. SRE and DevOps are complementary: DevOps accelerates delivery, SRE ensures the system holds as it scales.
How do you implement OpenTelemetry in an existing system?
We instrument your services with the OpenTelemetry SDK using auto-instrumentation where available and manual spans for critical paths. The OpenTelemetry Collector routes signals to your chosen backend: Prometheus for metrics, Loki or Elasticsearch for logs, Jaeger or Tempo for traces. Instrumentation is incremental — we start with the highest-traffic service paths and expand coverage sprint by sprint, with no production risk and no big-bang migration.
How long does an observability stack implementation take?
A foundational observability stack (Prometheus, Grafana dashboards, OpenTelemetry instrumentation for three to five services, and basic alerting) takes four to six weeks. Adding distributed tracing, log aggregation and SLO governance extends the engagement to ten to twelve weeks. Incident management automation and AIOps correlation layer on after that. We phase delivery so your team has meaningful visibility within the first two weeks, not at the end of the project.
Let's build something together
Get a free technical brief on your observability challenge — architecture, timeline, and cost estimate in 48 hours.
Get Free Technical Brief