What you'll take away
Engineering leaders are routinely asked to demonstrate the ROI of platform and infrastructure investment. The instinct is to reach for uptime, we maintained 99.9% availability, or for throughput metrics, the team shipped forty-seven stories this quarter. Neither of these tells the business anything meaningful about whether the engineering function is becoming more capable and efficient over time, or whether it's accumulating the kind of invisible debt that will produce a reliability crisis in twelve months.
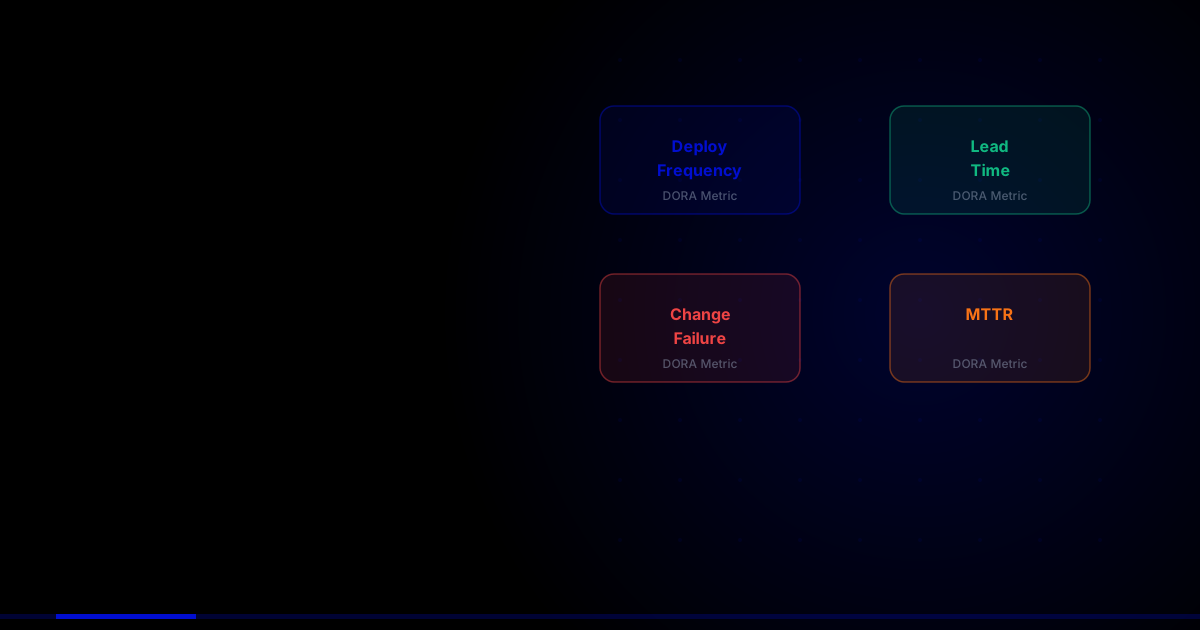
The DORA (DevOps Research and Assessment) metrics, developed through years of research on what separates high-performing engineering organisations from the rest, provide a framework for measuring engineering health that actually correlates with business outcomes. They are not perfect proxies, no metric is, but they are significantly better proxies than uptime or story points for understanding whether your engineering investment is compounding.
The Four DORA Metrics and What They Actually Measure
1. Deployment Frequency
How often your team deploys to production. Elite performers deploy on demand, multiple times per day. High performers deploy between once per day and once per week. This metric is a proxy for batch size, teams that deploy frequently are making smaller, lower-risk changes, getting faster feedback, and maintaining a smaller gap between code complete and user value delivery. Low deployment frequency is often a symptom of large, infrequent releases that carry high coordination overhead and elevated risk.
2. Lead Time for Changes
The time from code commit to that code running in production. This metric captures the efficiency of your delivery pipeline end to end: code review speed, CI build duration, testing thoroughness and speed, deployment process, and any approval gates or change management overhead. Long lead times indicate bottlenecks in the delivery process, places where value is sitting waiting rather than flowing. Elite performers have lead times under one hour; high performers, between one day and one week.
3. Change Failure Rate
The percentage of deployments that cause a production incident or require a hotfix. This is your quality signal. A high change failure rate indicates that your testing, review, or validation processes are not catching defects before they reach production. Elite performers have change failure rates below 5%; high performers between 5 and 15%. A change failure rate above 30%, not uncommon in organisations with inadequate test coverage or CI pipelines, means more than a quarter of your deployments require immediate remediation work, consuming capacity that should be spent on new value delivery.
4. Mean Time to Recovery (MTTR)
When an incident does occur, how long does it take to restore service? MTTR is a function of your detection capability (how quickly you know something is wrong), your response processes (how quickly the right people are engaged), and your recovery mechanisms (rollback speed, feature flags, hotfix deployment path). Elite performers recover in under one hour; high performers, within one day. MTTR above 24 hours indicates systemic issues in detection, escalation, or recovery that compound the business impact of every incident.
The research finding that makes DORA metrics compelling: high deployment frequency and high quality are not in tension. Elite performers deploy more frequently AND have lower change failure rates and faster MTTR than low performers. The intuition that 'slower means safer' is empirically wrong at the organisation level, safety comes from small batches and fast feedback, not from infrequent, large releases.
29% of cloud spend is wasted on average. Find yours.
Using DORA Metrics as Investment Drivers
The most valuable use of DORA metrics is not benchmarking against the DORA percentile buckets, it's using them to identify the specific bottlenecks in your delivery pipeline that are limiting throughput and quality, then investing in removing those bottlenecks.
- Long lead time: Audit your CI pipeline for slow build steps, long test suites, and manual approval gates. Parallelising tests, caching build artifacts, and implementing automated deployment gates frequently cuts lead time by 50–70%
- High change failure rate: Invest in test coverage, particularly integration and contract tests. Implement deployment strategies (canary, blue/green) that reduce the blast radius of a bad deployment
- Long MTTR: Invest in observability, alerting, and runbook automation. Implement feature flags that allow quick mitigation without a full deployment cycle
- Low deployment frequency: Decompose large deployment batches, implement trunk-based development, and remove manual coordination gates from the deployment process
Validated Outcomes
The DORA research programme, now in its tenth year and published annually as the Accelerate State of DevOps Report, consistently documents the business impact of DORA metric improvements. The 2023 report found that elite-performing engineering organisations (top DORA quartile) had 127x more frequent deployments and 2,604x faster recovery from incidents than low-performing organisations. Critically, the report also documented that elite performers had 3x lower change failure rates, empirically disproving the common assumption that deployment frequency trades off against stability. The organisations that ship fastest also break production least.
GYSP's DORA baseline assessments consistently find the same bottlenecks across mid-market engineering organisations: CI pipeline times averaging 45–90 minutes (versus elite benchmark of under 10 minutes), change failure rates of 15–25% (versus elite benchmark under 5%), and deployment batches that compound risk by combining multiple feature changes. Addressing the CI pipeline alone, through parallelisation, test optimisation, and artifact caching, typically brings deployment frequency from weekly to daily and lead time from days to under 4 hours within a single quarter.
GYSP's Cloud & DevOps Engineering practice conducts DORA baseline assessments as the first step of platform engineering engagements. The baseline tells us where the delivery pipeline has the highest leverage for improvement and the quarterly retake tells the client whether the investment in platform work is delivering the engineering health improvements that justify it.
“Uptime is a lagging indicator that tells you your system survived the past. DORA metrics are leading indicators that tell you whether your engineering organisation is building the capability to survive the future.”
— Akshay, Head of Delivery — GYSP.tech