What you'll take away
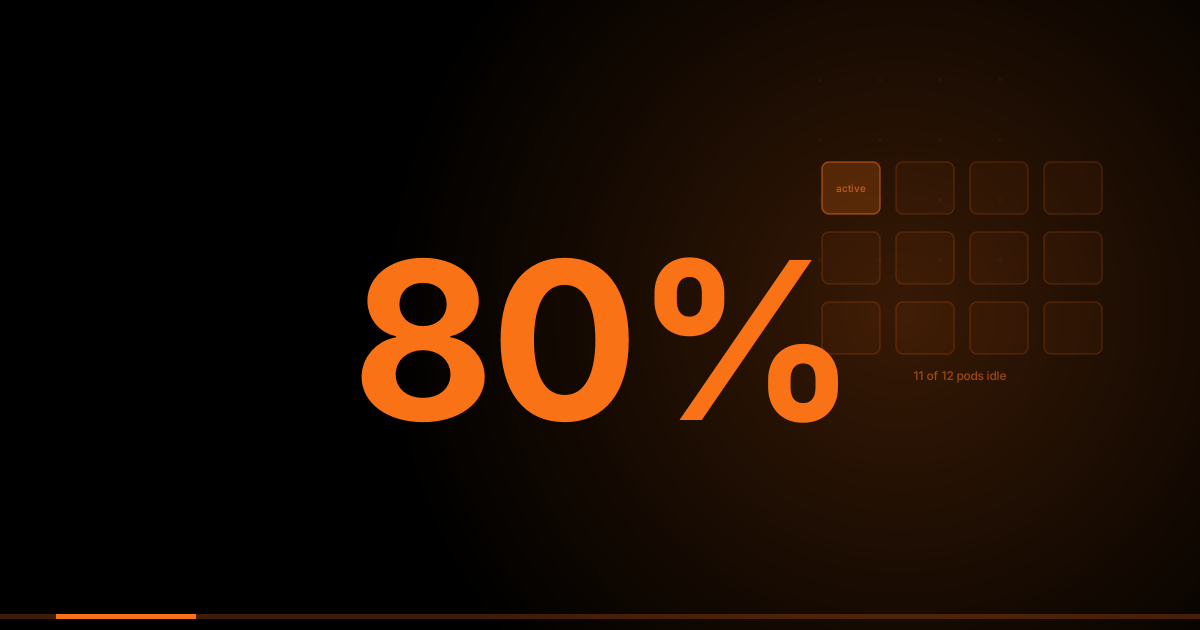
The cloud bill shows five hundred nodes in the Kubernetes cluster. The average CPU utilisation across the cluster is 18%. The average memory utilisation is 22%. Roughly four-fifths of the compute the company is paying for is idle at any given moment. This is the Kubernetes black hole: the gap between the resources Kubernetes has scheduled, the sum of all pod resource requests and limits, and the resources applications actually consume.
The gap is not an accident. It's the rational result of engineering teams protecting their applications from resource starvation: set your resource requests high enough that the scheduler always places your pod on a node with sufficient capacity, set your limits high enough that your application isn't OOM-killed during spikes. The problem is that every team applies these safety margins independently, and the aggregate across a large cluster is a massive amount of reserved-but-never-used capacity that you're paying for continuously.
The Three Layers of Kubernetes Cost Inefficiency
1. Overprovisioned Resource Requests
A Java application that actually uses 400m CPU at steady state and 800m during brief spikes might have a resource request of 2 CPUs set by the team during initial deployment, carried forward through dozens of subsequent deployments without review. Kubernetes uses requests, not limits, not actual usage, to determine how many pods can be scheduled on a node. An overprovisioned request wastes cluster capacity even if the application never uses it.
2. Over-replicated Deployments
Horizontal pod autoscaling is configured based on CPU or memory utilisation reaching a threshold. If the thresholds are set conservatively, scale out when CPU exceeds 40%, the deployment will maintain more replicas than necessary at normal traffic levels. Combined with overprovisioned requests per replica, this creates a multiplicative waste: more replicas than needed, each consuming more than it uses.
3. Namespace and Cluster Proliferation
Organisations with many teams often create separate clusters or namespaces for each team, service, or environment. Each cluster has minimum viable infrastructure: control plane overhead, system namespaces, daemonsets. The per-cluster fixed overhead is significant, and clusters running small workloads at low utilisation are often cheaper to consolidate than to operate separately.
The diagnosis: export the Kubernetes resource requests and limits for every running pod, then compare against actual CPU and memory usage from your metrics system (Prometheus, Datadog, etc.). The ratio of allocated to actual is your waste multiplier. Clusters averaging 15–25% utilisation have a waste multiplier of 4–7x.
The Right-Sizing Toolkit
- VPA (Vertical Pod Autoscaler) in recommendation mode: Run VPA without enforcement to generate right-sizing recommendations based on actual historical usage. Use the recommendations as input to manual resource request adjustments without the risk of VPA automatically changing running pods
- Goldilocks: An open source tool from Fairwinds that runs VPA in recommendation mode across a cluster and generates a dashboard of suggested resource adjustments, with estimated cost savings
- KEDA (Kubernetes Event Driven Autoscaling): Enables scale-to-zero and event-driven scaling based on external signals (queue depth, Kafka consumer lag, Prometheus metrics) rather than CPU/memory thresholds, dramatically reducing idle capacity
- Node consolidation: Kubernetes 1.27+ includes Cluster Autoscaler improvements that consolidate workloads onto fewer, larger nodes and remove underutilised nodes. Combined with right-sized requests, this reduces the total number of nodes required
29% of cloud spend is wasted on average. Find yours.
Validated Outcomes
Datadog's annual Kubernetes State of Cloud Cost report documented that the median Kubernetes cluster in their customer base runs at below 20% average CPU utilisation across all nodes, meaning over 80% of provisioned compute capacity is idle at any given time. The cause is consistent: resource requests set during initial cluster deployment are rarely reviewed after the fact, HPA is either absent or set with conservative thresholds, and node pools are sized for theoretical peak loads that may have been substantially exceeded in the original capacity planning. The waste is structural, not accidental.
GYSP's Kubernetes right-sizing engagements begin with a 2-week cluster observation period using Prometheus metrics to capture actual CPU and memory usage at P50, P90, and P99 across all workloads. The data consistently shows that 60–75% of pods have resource requests more than 2x their actual P90 usage. Adjusting requests to P90 actual usage plus a 30% safety margin, combined with node consolidation, delivers the 40–55% cluster cost reduction GYSP consistently achieves without any changes to application code.
The Right-Sizing Process
Implementing Kubernetes right-sizing without disrupting production requires a methodical approach: start with VPA recommendations in recommendation mode (no enforcement), review the suggestions for the top twenty cost-consuming workloads by allocated resources, adjust resource requests conservatively (to the P90 usage plus 30% headroom rather than the maximum), deploy to staging and monitor for OOM kills and CPU throttling over 48 hours, then roll out to production with gradual traffic shifting.
The target is not 100% utilisation, that leaves no headroom for traffic spikes. The target is 50–70% cluster-level utilisation for CPU-intensive clusters, enabled by right-sized requests that reflect actual usage plus a reasonable safety margin rather than aspirational headroom.
GYSP's Cloud & DevOps Engineering practice has conducted Kubernetes cost optimisation engagements for engineering teams at growth-stage and enterprise companies. The typical finding: 40–55% reduction in cluster compute costs is achievable through request right-sizing, HPA threshold adjustment, and node consolidation without changing application code or reducing reliability.
“Every Kubernetes cluster has a utilisation story. Most of them start with 'we set generous requests during the migration and never reviewed them.' That's four years of paying for headroom that nobody is using.”
— Akshay, Head of Delivery — GYSP.tech