What you'll take away
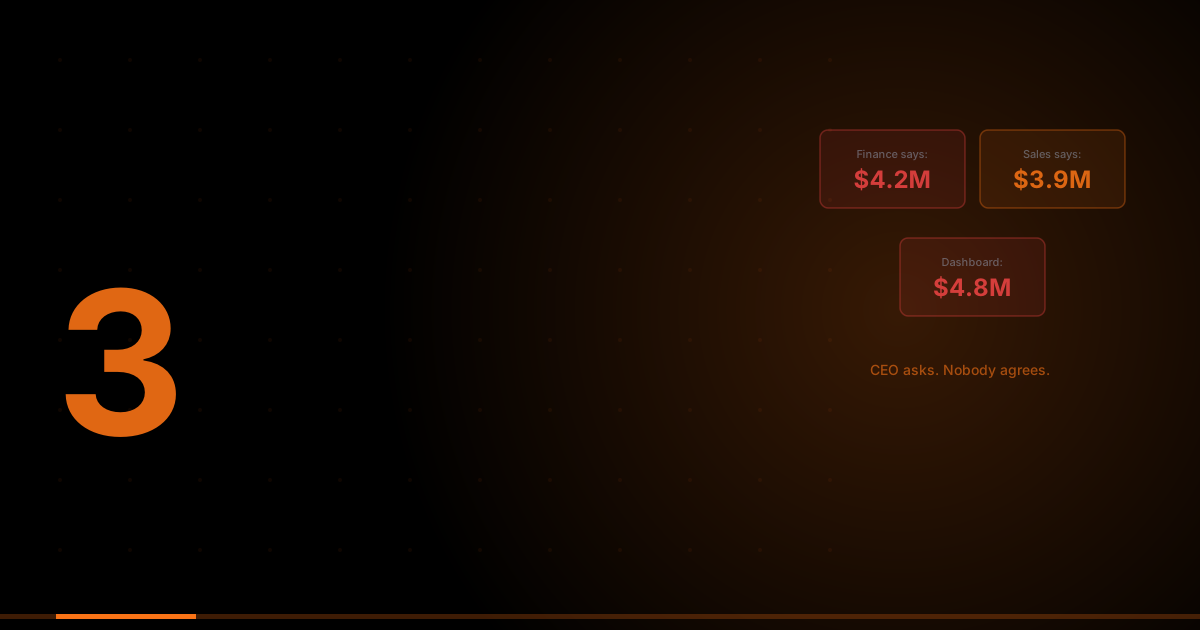
The scenario plays out the same way across organisations. A data analyst presents a quarterly revenue breakdown to the executive team. Halfway through the deck, the CFO says: 'These numbers don't match what I'm seeing in Salesforce.' The meeting stops. Everyone looks at the analyst. The next three hours are spent tracing the discrepancy through three pipeline stages to find a data type change that was deployed six weeks ago and silently corrupted a join condition that nobody noticed because nobody was monitoring it.
This is not a reporting failure. It is an observability failure. And it is the most common way data quality problems are discovered in organisations that have not invested in data observability infrastructure.
The question is not whether your data has quality problems. All data does, at sufficient scale and complexity. The question is whether you discover those problems before your CEO does.
Why Data Quality Problems Are Hard to See
Traditional software monitoring is relatively straightforward: a service is running or it is not, an API returns a 200 or it does not, a query completes in 50ms or it times out. Data quality failures are statistically distributed and semantically meaningful, they are not system failures, they are logical failures that produce outputs that are structurally valid but factually wrong.
A pipeline that produces a table with 10 million rows when it should have produced 10.3 million is not broken in any technical sense. The job completed. No error was thrown. The table exists. The join worked. But 300,000 rows are missing because an upstream schema change renamed a column that your pipeline was filtering on, and the filter is now matching nothing, silently, completely.
This is what makes data quality failures so expensive: they are invisible until something downstream depends on the wrong data and the error surfaces in a business context where it costs significantly more to fix than a pipeline correction would have.
The Five Classes of Data Quality Failure
- Freshness failures: data that should have been updated at 06:00 has not arrived by 09:00. Nobody knows, because there is no alerting on data arrival SLAs. The morning dashboard shows yesterday's figures, and analysts spend their morning on decisions built on stale data.
- Volume anomalies: a table that normally contains between 50,000 and 55,000 daily records contains 12,000 today. An upstream data source went offline at midnight and resumed at 05:00, and the gap is present in every downstream model that queries this table.
- Schema drift: an upstream system renamed a field, changed a data type from INT to BIGINT, or added a NOT NULL constraint. The pipeline does not fail, it just produces subtly wrong output for every transformation that depended on the original schema.
- Distribution anomalies: a numeric field that historically has a mean of 4,200 now has a mean of 42,000 because an upstream system changed units from pounds to pence without notifying the data team. Every calculation using this field is wrong by a factor of 100.
- Referential integrity failures: a foreign key relationship that should be 100% matched has a 12% null rate today, because an upstream system is producing records with IDs that do not exist in the reference table. Every join on this relationship is silently dropping 12% of the data.
Monte Carlo's 2024 State of Data Quality report found that data engineers spend an average of 40% of their working time on data quality issues, identifying, diagnosing, and resolving problems that better observability infrastructure would have caught earlier and cheaper.
What Data Observability Is (And Is Not)
Data observability is the capability to understand the health of your data at every point in the pipeline and to be alerted when that health degrades, before the degradation reaches a business consumer. It is the data equivalent of application performance monitoring: continuous measurement of the signals that indicate whether your data is fresh, complete, accurate, and consistent.
Data observability is not data quality rules written by an analyst to validate specific business logic. Those are data quality tests, necessary, but point-in-time. Observability is the continuous monitoring layer that detects anomalies across dimensions you did not anticipate and surfaces them proactively rather than in response to a complaint.
The Four Pillars of Data Observability
1. Freshness Monitoring
Every data asset consumed by a business process has an expected update cadence. Freshness monitoring tracks whether each asset meets that cadence and alerts when it does not, before the staleness reaches a consumer. This requires knowing the expected update frequency of every data asset, which itself requires a data catalogue or lineage layer that documents asset ownership and update SLAs.
2. Volume and Distribution Monitoring
ML-based anomaly detection on row counts and statistical distributions catches failures that rule-based tests miss: the subtle shift in a numeric distribution indicating a unit change upstream, the volume drop indicating a partial source failure, the null rate spike indicating a schema change in a foreign key field. These patterns are too complex to specify as rules, they require a statistical baseline and anomaly detection logic that adapts as the baseline evolves.
3. Schema Change Detection
42% of AI projects fail at the data layer. Where do you stand?
Schema drift is one of the most common causes of silent pipeline failures. A robust observability platform tracks schema changes across every data asset and alerts when a column is added, renamed, removed, or has its data type changed, immediately, not when a downstream transformation breaks. This gives the data engineering team the opportunity to assess impact and update affected pipelines before the schema change propagates to business consumers.
4. Lineage-Aware Impact Analysis
When a data quality issue is detected, the first question is: what is downstream of this? Column-level lineage, the ability to trace exactly which transformations, models, and dashboards depend on the affected data asset, turns a quality alert from a flag into an actionable impact assessment. Without lineage, the data engineering team has to manually investigate every potential downstream consumer. With lineage, they know immediately.
The Minimum Viable Observability Stack
- 1Instrument every pipeline with arrival time logging, the simplest freshness check requires only knowing when each asset was last updated, which most orchestration tools (Airflow, Prefect, Dagster) provide natively.
- 2Add row count monitoring to every critical table, a daily comparison of expected versus actual row count, with alerting when the variance exceeds a configurable threshold, catches 60–70% of volume anomalies.
- 3Enable schema change notifications from your data warehouse. Snowflake, BigQuery, and Databricks all have mechanisms to notify on schema changes; route these to the engineering team before they propagate downstream.
- 4Build a downstream impact map, even a spreadsheet that documents which dashboards depend on which tables gives a starting point for impact assessment when a quality issue is detected.
- 5Establish an on-call rotation for data quality alerts, alerts without owners are noise. Rotating responsibility creates accountability and builds institutional knowledge about which alert patterns matter.
Validated Outcomes
Stitch Fix, the data-driven fashion retailer, published a detailed engineering case study on how data quality failures propagated to recommendation engine errors, and how their investment in data observability reduced the frequency and business impact of those failures. The key metric Stitch Fix documented: before systematic data quality monitoring, data quality incidents affecting production recommendations were detected on average 3–5 days after they began, primarily through customer complaints or business analyst investigation. After deploying pipeline monitoring with automated anomaly detection, detection latency dropped to under 4 hours, and the downstream recommendation quality incidents were caught before they affected more than a small percentage of the user base.
GYSP's data observability deployments follow a three-layer implementation: dbt tests for transformation-layer validation, Great Expectations or Monte Carlo for raw data freshness and volume monitoring, and schema change notifications routed to engineering with documented downstream impact maps. This stack, implementable in 2–4 weeks on any modern data warehouse, addresses the three failure modes that cause the majority of executive-visible data quality incidents: silent schema changes, upstream volume drops, and distribution shifts in key features.
Purpose-Built Tooling vs. Rolling Your Own
The tooling layer for data observability has matured significantly. Purpose-built platforms, Monte Carlo, Acceldata, Metaplane, provide out-of-the-box freshness, volume, and distribution monitoring with ML-based anomaly detection. Open-source options, Great Expectations, Soda Core, provide rule-based quality testing frameworks embeddable in pipeline code. dbt tests provide transformation-layer validation for organisations already using dbt.
The choice of tooling is less important than the practice architecture: who owns data quality alerts, what is the escalation path when an alert fires, what is the SLA for investigating and resolving a quality issue, and how does the resolution get communicated to the downstream consumers who were affected? Without this practice layer, observability tooling produces alerts that nobody acts on.
GYSP's Data Engineering & Analytics practice builds data observability infrastructure as a standard component of every pipeline engagement. The teams that invest in observability early spend a fraction of the time on data quality incidents compared to those who bolt it on after the first executive meeting that gets derailed by a data discrepancy.
“The cost of a data quality problem is not the cost of fixing the pipeline. It is the cost of the decisions that were made on the wrong data before anyone knew the data was wrong. That is the number that justifies observability investment.”
— Ankush, Chief Technology Officer — GYSP.tech