What you'll take away
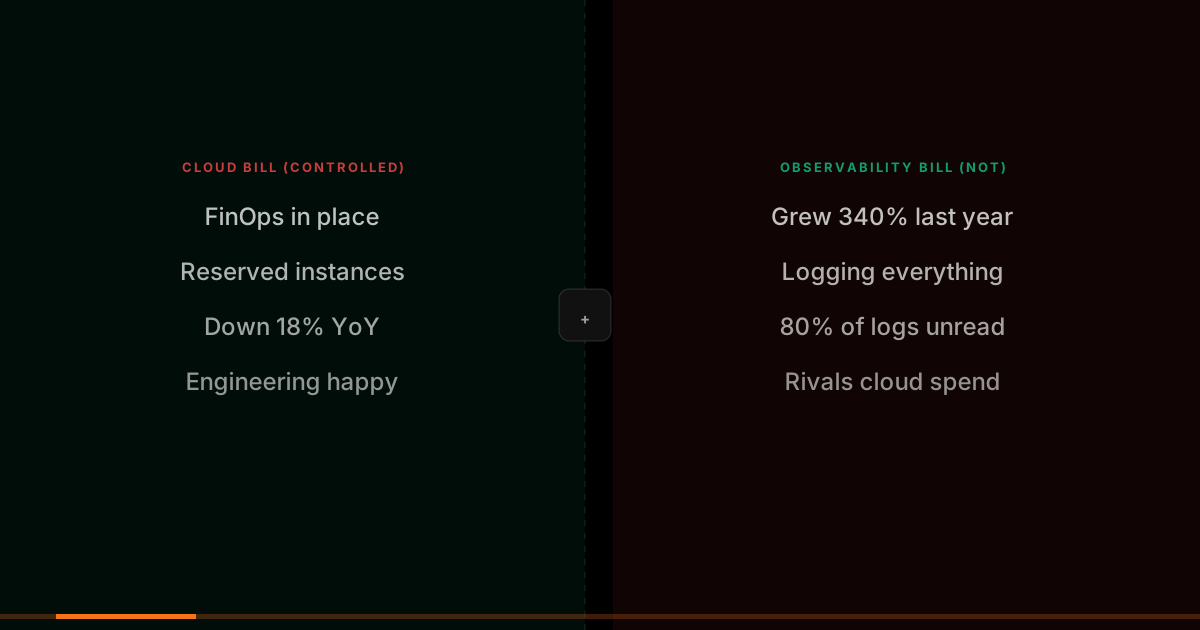
It starts with a conversation in the engineering all-hands. Someone mentions that the Datadog bill this month exceeded the AWS bill. Silence in the room. Then nods, because everyone already knew something was off, but nobody had put the numbers side by side.
Observability platform costs have become a genuine CFO-level concern at mid-market and growth-stage technology companies. The problem compounds predictably: engineering teams adopt an observability platform in the early startup phase, when cost is not a concern. As the company grows, more services get instrumented, log volumes increase with traffic, custom metrics proliferate, and the per-host and per-GB pricing model turns linear growth in infrastructure into super-linear growth in observability spend.
The Three Cost Drivers of Observability Spend
Log Volume
Most observability platforms charge per gigabyte of log data ingested and indexed. Log volume grows with traffic but it also grows with logging verbosity, debug logs left enabled in production, verbose framework logging that wasn't explicitly disabled, and the accumulation of new services that all ship INFO-level logs for every request. A team that deploys a new service every two weeks and doesn't audit logging verbosity will see log ingestion costs grow faster than the business.
Metric Cardinality
Custom metrics with high cardinality, metrics tagged with dimensions like user ID, request ID, or arbitrary string values, create a combinatorial explosion in time series storage. A metric tagged with user ID has as many time series as there are active users. At custom metric pricing of a few cents per time series per month, a single high-cardinality metric can generate thousands of dollars in monthly billing.
Trace Sampling Strategy
APM (Application Performance Monitoring) platforms typically charge per traced request or per span. A system that sends 100% of traces to an APM platform from high-traffic services is paying for a vast amount of identical, low-value trace data. A request that takes 40ms and completes successfully the ten-thousandth time provides essentially no additional signal over the nine-thousand-nine-hundred-and-ninety-ninth time but it still costs the same.
The observability cost reduction we see most often: debug-level logs left enabled in production, flooding the ingestion pipeline with internal state logging that nobody reads. Disabling debug logs in production services routinely reduces log ingestion volume by 60–80% with zero reduction in operational visibility.
What Your Observability Bill Should Actually Cost
The benchmark engineering leaders use when justifying observability spend to finance: observability tooling should represent 10–15% of total cloud infrastructure spend. Anything above 20% indicates a structural cost problem, not a business necessity.
For a company spending $500K/month on cloud infrastructure, a well-managed observability stack should cost $50K–$75K/month. If your Datadog or New Relic invoice exceeds $100K/month at that scale, the gap is almost entirely addressable through sampling, cardinality governance, and retention tiering, not by reducing what you observe.
The question finance actually asks is not 'why do we have observability?', it's 'why does it cost this much?' The answer that lands: benchmark your current spend as a percentage of cloud infrastructure spend, then present a concrete 30-day reduction plan. That framing converts a budget defence into a cost reduction initiative.
29% of cloud spend is wasted on average. Find yours.
Strategies That Reduce Observability Costs Without Losing Visibility
- Tiered log retention: Not all logs need to be indexed and searchable. Separate hot (fully indexed, expensive, 7–14 days), warm (compressed, searchable with delay, 30–90 days), and cold (archive, 1+ years) tiers with dramatically different pricing
- Log sampling for high-volume success paths: Sample 10–20% of success logs from high-throughput services, but retain 100% of errors, warnings, and slow requests. Operational questions about what's working don't require every success log
- Metric cardinality governance: Establish tagging standards that prohibit high-cardinality values as metric dimensions. User IDs, request IDs, and arbitrary strings belong in logs or traces, not in metrics
- Head-based trace sampling with tail-based error retention: Sample a fraction of successful traces (5–10%), but retain 100% of traces for slow requests and errors where forensic value is highest
- OpenTelemetry as a vendor hedge: Instrument your applications with the vendor-neutral OpenTelemetry standard and use a collector layer that can route data to multiple backends, giving you the ability to switch vendors without re-instrumenting
Validated Outcomes
Grafana Labs published a detailed case study of Carrefour, the French retail giant, migrating from a commercial observability stack to the open source Grafana LGTM stack (Loki, Grafana, Tempo, Mimir). Carrefour's primary driver was cost: their commercial observability bill had reached €2 million annually and was growing with data volume faster than the business could justify. After migration to self-managed Grafana stack with Prometheus and Loki, the annual observability infrastructure cost fell to under €300,000, an 85% reduction. The migration took approximately 18 months and required dedicated platform engineering resource, but Carrefour reported no degradation in mean time to detection for production incidents.
GYSP's observability cost optimisation engagements deliver results without necessarily requiring a full stack migration. The first intervention, sampling strategy and cardinality governance, typically produces 40–50% cost reduction within 30 days on any observability platform. For clients whose observability bill exceeds $50K/month, GYSP then conducts an open source alternative assessment to determine whether the operational investment in a self-managed stack is justified by the additional savings available.
The Open Source Alternative Assessment
The observability open source ecosystem has matured substantially: Prometheus and Grafana for metrics and dashboards; Loki for log aggregation; Jaeger or Tempo for distributed tracing. A self-managed open source observability stack running on your own cloud infrastructure can reduce observability spend by 70–80% compared to a commercial SaaS platform but adds operational burden: your team owns the availability, scaling, and maintenance of the observability infrastructure.
The economics favour the open source route for organisations with strong platform engineering capability and workloads that require high observability data volumes. For organisations without dedicated platform engineering teams, the operational complexity of a self-managed observability stack may not be worth the savings.
GYSP's Cloud & DevOps Engineering practice has conducted observability cost optimisation engagements for clients ranging from Series B startups to enterprise scale. The consistent pattern: 40–70% cost reduction is achievable without reducing operational effectiveness, through a combination of sampling strategy, cardinality governance, and retention tiering.
“The goal of observability is to answer operational questions, not to store every byte of telemetry. Teams that conflate completeness with value end up paying for data that nobody will ever look at.”
— Akshay, Head of Delivery — GYSP.tech