Strategize, Build, Secure & Scale your AI ecosystem — With 100% Execution Certainty
Senior Architects embedded in your AI, cloud, data, and security — trusted by 100+ enterprises across 9 industries.
Technology Partners
Trusted by industry leaders
What We Do
End-to-End IT Solutions
From strategy to execution — every capability you need to build, scale, and protect your technology.
IT Consulting
Turn IT into measurable ROI
Fractional CTO
Senior tech leadership on demand — without the full-time cost
AI/ML
Production AI, not proof-of-concept
Cloud & DevOps
Faster deployments. Zero downtime. Lower costs.
Data Engineering
AI-ready data infrastructure, built for scale
Automation
Automate the work that shouldn't need people
Cyber Security
Zero Trust security, built for the cloud-first enterprise
Custom Software
Bespoke enterprise software built around your workflows
Product Engineering
From MVP to market — complete product lifecycle ownership
Web Development
Fast, modern web applications built to convert
Mobile Apps
iOS & Android apps your users love
Managed IT
SRE-grade reliability, AIOps-powered operations
Staff Augmentation
Top-tier pre-vetted engineers, ready in days
Digital Marketing
Demand generation that fills your pipeline
Proven Results
Work That Speaks for Itself
Real outcomes from real engagements — not hypothetical projections.


Client Voices
What Our Clients Say
“GYSP's expertise in secure, compliant infrastructure allowed us to scale transactions confidently. From AWS-to-GCP migration to DevSecOps pipelines, their work cut deployment time and strengthened compliance. What impressed us most was how they delivered cost optimisation while ensuring zero downtime.”
“The GYSP team completely transformed our infrastructure. Moving from a monolith to microservices, building full observability, and ensuring compliance — all while keeping costs predictable. Teachers and students experienced faster, more reliable access, and our dev team gained real velocity. They've been more of a partner than a vendor.”
“We needed a partner who could modernise our travel platform while meeting strict compliance standards, and GYSP delivered beyond expectations. Their expertise in cloud migration, security, and automation gave us a scalable foundation to support millions of travellers. The platform runs smoother, safer, and faster — exactly what we needed.”
“Partnering with GYSP gave us the foundation we needed to compete in a fast-moving market. Their team built a secure ordering platform, optimised mobile experience, and automated restaurant onboarding. The result was a smoother customer journey and the ability to handle peak demand without downtime. They deliver at startup speed.”
“Team GYSP helped us take an idea and turn it into a trading tool traders actually love. Their forecasting engine, risk-reward dashboards, and clean UX made strategy testing faster and decision-making easier. We've seen higher engagement and trust from our user base thanks to their precise execution.”
“We wanted a seamless digital platform that could grow with us, and GYSP delivered exactly that. The scalable architecture, mobile-first experience, and real-time analytics helped us personalise customer journeys and expand regionally much faster. Their combination of technical depth and strategic input makes them invaluable to our growth story.”
“Starting from zero visibility in a market dominated by established brands felt impossible. GYSP built us an SEO strategy that delivered 194,000 organic visitors in our first year. They didn't just chase rankings — they focused on the kind of traffic that actually converts. The results genuinely surprised us.”
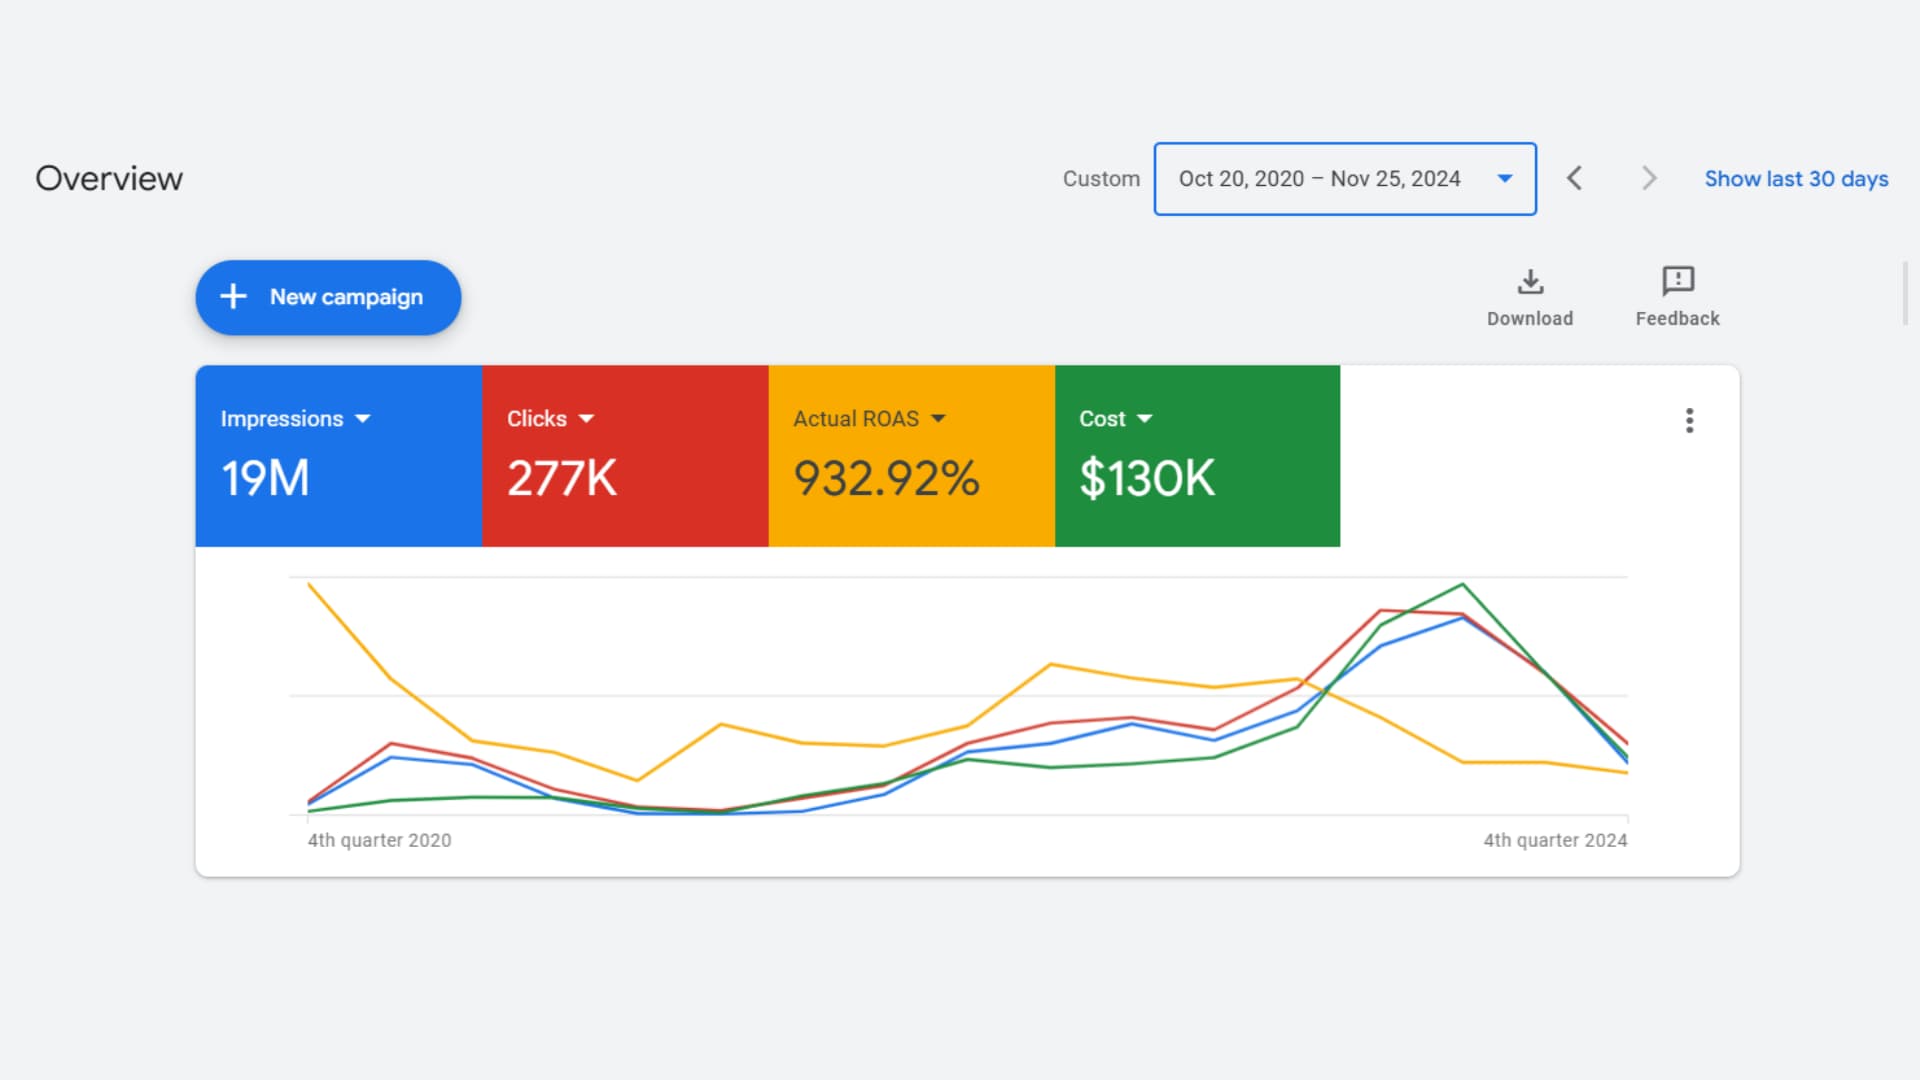
“We handed GYSP a $130K annual ad budget and asked them to make it work harder. Over four years, they've sustained a 932% ROAS — not through one lucky campaign, but by consistently refining structure, bidding, and creative. That kind of sustained performance is genuinely rare in this industry.”
“Our security posture was a patchwork of manual controls before GYSP stepped in. They embedded DevSecOps across our entire pipeline, implemented zero-trust architecture, and got us audit-ready across three compliance frameworks simultaneously. Our CISO finally has full confidence in the infrastructure.”
“We were making business decisions on data that was 48 hours old. GYSP rebuilt our entire data pipeline — Fivetran to Snowflake, automated ETL, real-time dashboards — and suddenly we could act on what was happening now, not yesterday. The shift in business velocity was immediate.”
“We needed a technology roadmap — not just for today, but for five years of rapid expansion. GYSP's consulting team audited our stack, identified the gaps we hadn't seen, and gave us a phased plan we could actually execute. Their advice is direct, practical, and grounded in what they've built for companies like ours.”
“Our Meta campaigns were burning budget on unqualified audiences and creative that wasn't converting. GYSP restructured everything — audience segmentation, funnel architecture, creative rotation — and brought our CPA down 38% while scaling reach past 2.4 million. The creative strategy alone was worth the engagement.”
“When our CTO left mid-Series B, the board wanted answers we couldn't give. GYSP embedded a Fractional CTO within eight days — and within 30 days we had a full technology audit, a restructured engineering team, and a defensible AI roadmap. The technology due diligence question went from our biggest risk to a story we were proud to tell.”
“We had strong clinicians and a proven business model but no technical co-founder. GYSP's Fractional CTO owned the architecture decisions, hired and managed the engineering team, and had us in production in five months. The cost was a fraction of a full-time hire — and the quality of decision-making was better than I expected.”
“We were drowning in unstructured freight documentation — PDFs, emails, contracts in three languages. GYSP built a RAG pipeline that extracts, classifies, and routes everything automatically. What two full-time staff handled daily now runs in 35 minutes with 93% accuracy. The ROI case closed itself in the first week of production.”
“We needed to replace a 15-year-old rules engine with a production-grade ML risk model. GYSP rebuilt the entire MLOps pipeline — feature engineering, training, deployment, and automated retraining — and gave us explainability tooling our actuaries could use in regulatory submissions. Underwriting speed improved 3x in the first quarter.”
“We handed GYSP a Figma file and a requirements document. Sixteen weeks later, we had a production SaaS platform with 300 paying beta customers and no unplanned outages since launch. This is not the typical agency experience — they own outcomes, not just tickets.”
“We'd accumulated three years of technical debt that was starting to show in reliability. GYSP ran a strangler-fig migration — new services in parallel, traffic migrated incrementally — with zero downtime to clinical users. The platform now holds 99.97% uptime, which matters when clinicians depend on it around the clock.”
“Our Shopify store was converting at 1.4% — below industry average. GYSP rebuilt it headless: Next.js front-end, optimised checkout, a CMS our marketing team can actually use. Page speed hit 96 on Core Web Vitals. Conversion rate is at 2.9% and still improving three months post-launch.”
“Our student-facing portal was a legacy application we were embarrassed to demo to enterprise clients. GYSP rebuilt it in Next.js — real-time updates, role-based access, SCORM compliance, API-first architecture. The new portal became a sales asset within a month. Two enterprise deals closed partly on the demo alone.”
“We needed three senior React engineers for a critical product milestone — immediately, not in three months. GYSP had three engineers in our sprint within nine business days. No ramp-up theatre. They were leading architecture discussions by the end of week one. We've extended their engagement three times since.”
“We had a six-month data engineering backlog and no realistic hiring path. GYSP embedded two senior engineers in under two weeks — deeply experienced in dbt, Snowflake, and Airflow — working inside our GitHub and Jira as if they'd been here for years. The backlog cleared in four months. They're still here.”
“We needed DevOps engineers who understood OT/IT convergence — not generalists who'd need six months to grasp the environment. GYSP matched us with two senior engineers with prior industrial experience. They were contributing to architecture decisions in week two. We retained both of them permanently six months later.”
“Our claims processing team was manually handling 900 documents a day. GYSP built an intelligent document pipeline — classification, extraction, validation — that now handles 72% of cases automatically. The remaining 28% arrive pre-annotated for our agents. Team capacity effectively doubled without a single new hire.”
“We were running seven tools that didn't talk to each other. GYSP mapped our entire operations workflow, removed the redundant steps, and built an automation layer using Make and a custom LLM agent for exception handling. Contract turnaround dropped from four days to under six hours. Operations overhead fell 43%.”
“We had 200 machines generating data that nobody was reading. GYSP built the IoT pipeline, real-time monitoring dashboards, and predictive maintenance models that flag failures 48–72 hours before they happen. Unplanned downtime is down 61% year-on-year. It has completely changed how our maintenance team makes decisions.”
“Industry 4.0 was a board priority but nobody could agree on where to start. GYSP assessed our entire value stream, identified the three highest-ROI digitisation opportunities, and delivered working solutions in ten weeks. The production visibility we have now has fundamentally changed how we allocate capacity across shifts.”
“Building patient-facing software that clinicians will actually use — while meeting HIPAA, HL7 FHIR, and our own security requirements — is genuinely difficult. GYSP got it right. Clinical staff adoption hit 76% in 90 days, which is extraordinary for new clinical software. The architecture held through a 4x patient load surge without degradation.”
“Scaling from an MVP to a HIPAA-compliant, SOC 2-ready platform felt like two separate projects happening at once. GYSP handled both simultaneously — encryption, audit logging, BAAs, penetration testing — while scaling our backend for 10x load. We passed our first enterprise security review without a single finding.”
“We had no real-time visibility across our warehouse network. GYSP built an end-to-end tracking system — inbound shipments to last-mile delivery — with live dashboards our ops team and clients can both see. Customer queries about shipment status dropped 67% in month one because the answer was already in front of them.”
“Our order management system was costing us enterprise clients. GYSP rebuilt the integration layer — WMS, carrier APIs, client systems — with automated exception handling and real-time SLA monitoring. Error rates fell from 4.1% to 0.2%. We've onboarded seven enterprise accounts in the six months since the rebuild.”
“We were spending half our engineering capacity fighting infrastructure fires. GYSP set up full observability, rewrote our on-call runbooks, and introduced error budgets that gave product and engineering a shared language for the first time. MTTR dropped from over three hours to 18 minutes. Engineering morale improved almost immediately.”
“We had a mobile app customers downloaded once and never reopened. GYSP rebuilt it from scratch — performance-first, personalised feed, one-tap reorder, a push strategy that actually respects the user. Day-30 retention went from 8% to 34%. Mobile channel revenue doubled in the first quarter post-launch.”
“Our legacy booking app was a consistent source of one-star reviews. GYSP redesigned and rebuilt it in React Native — offline mode, real-time inventory sync, a checkout flow that doesn't lose users. App Store rating went from 2.8 to 4.6 in four months. Booking conversion from search to confirmed reservation improved 31%.”
“We were managing a fleet data platform held together with scripts and manual interventions. GYSP modernised the entire stack — event-driven microservices on Kubernetes, real-time telemetry pipelines, a dealer-facing dashboard that actually works. Vehicle status query latency went from 12 seconds to under 400 milliseconds.”
“GYSP's expertise in secure, compliant infrastructure allowed us to scale transactions confidently. From AWS-to-GCP migration to DevSecOps pipelines, their work cut deployment time and strengthened compliance. What impressed us most was how they delivered cost optimisation while ensuring zero downtime.”
“The GYSP team completely transformed our infrastructure. Moving from a monolith to microservices, building full observability, and ensuring compliance — all while keeping costs predictable. Teachers and students experienced faster, more reliable access, and our dev team gained real velocity. They've been more of a partner than a vendor.”
“We needed a partner who could modernise our travel platform while meeting strict compliance standards, and GYSP delivered beyond expectations. Their expertise in cloud migration, security, and automation gave us a scalable foundation to support millions of travellers. The platform runs smoother, safer, and faster — exactly what we needed.”
“Partnering with GYSP gave us the foundation we needed to compete in a fast-moving market. Their team built a secure ordering platform, optimised mobile experience, and automated restaurant onboarding. The result was a smoother customer journey and the ability to handle peak demand without downtime. They deliver at startup speed.”
“Team GYSP helped us take an idea and turn it into a trading tool traders actually love. Their forecasting engine, risk-reward dashboards, and clean UX made strategy testing faster and decision-making easier. We've seen higher engagement and trust from our user base thanks to their precise execution.”
“We wanted a seamless digital platform that could grow with us, and GYSP delivered exactly that. The scalable architecture, mobile-first experience, and real-time analytics helped us personalise customer journeys and expand regionally much faster. Their combination of technical depth and strategic input makes them invaluable to our growth story.”
“Starting from zero visibility in a market dominated by established brands felt impossible. GYSP built us an SEO strategy that delivered 194,000 organic visitors in our first year. They didn't just chase rankings — they focused on the kind of traffic that actually converts. The results genuinely surprised us.”
“We handed GYSP a $130K annual ad budget and asked them to make it work harder. Over four years, they've sustained a 932% ROAS — not through one lucky campaign, but by consistently refining structure, bidding, and creative. That kind of sustained performance is genuinely rare in this industry.”
“Our security posture was a patchwork of manual controls before GYSP stepped in. They embedded DevSecOps across our entire pipeline, implemented zero-trust architecture, and got us audit-ready across three compliance frameworks simultaneously. Our CISO finally has full confidence in the infrastructure.”
“We were making business decisions on data that was 48 hours old. GYSP rebuilt our entire data pipeline — Fivetran to Snowflake, automated ETL, real-time dashboards — and suddenly we could act on what was happening now, not yesterday. The shift in business velocity was immediate.”
“We needed a technology roadmap — not just for today, but for five years of rapid expansion. GYSP's consulting team audited our stack, identified the gaps we hadn't seen, and gave us a phased plan we could actually execute. Their advice is direct, practical, and grounded in what they've built for companies like ours.”
“Our Meta campaigns were burning budget on unqualified audiences and creative that wasn't converting. GYSP restructured everything — audience segmentation, funnel architecture, creative rotation — and brought our CPA down 38% while scaling reach past 2.4 million. The creative strategy alone was worth the engagement.”
“When our CTO left mid-Series B, the board wanted answers we couldn't give. GYSP embedded a Fractional CTO within eight days — and within 30 days we had a full technology audit, a restructured engineering team, and a defensible AI roadmap. The technology due diligence question went from our biggest risk to a story we were proud to tell.”
“We had strong clinicians and a proven business model but no technical co-founder. GYSP's Fractional CTO owned the architecture decisions, hired and managed the engineering team, and had us in production in five months. The cost was a fraction of a full-time hire — and the quality of decision-making was better than I expected.”
“We were drowning in unstructured freight documentation — PDFs, emails, contracts in three languages. GYSP built a RAG pipeline that extracts, classifies, and routes everything automatically. What two full-time staff handled daily now runs in 35 minutes with 93% accuracy. The ROI case closed itself in the first week of production.”
“We needed to replace a 15-year-old rules engine with a production-grade ML risk model. GYSP rebuilt the entire MLOps pipeline — feature engineering, training, deployment, and automated retraining — and gave us explainability tooling our actuaries could use in regulatory submissions. Underwriting speed improved 3x in the first quarter.”
“We handed GYSP a Figma file and a requirements document. Sixteen weeks later, we had a production SaaS platform with 300 paying beta customers and no unplanned outages since launch. This is not the typical agency experience — they own outcomes, not just tickets.”
“We'd accumulated three years of technical debt that was starting to show in reliability. GYSP ran a strangler-fig migration — new services in parallel, traffic migrated incrementally — with zero downtime to clinical users. The platform now holds 99.97% uptime, which matters when clinicians depend on it around the clock.”
“Our Shopify store was converting at 1.4% — below industry average. GYSP rebuilt it headless: Next.js front-end, optimised checkout, a CMS our marketing team can actually use. Page speed hit 96 on Core Web Vitals. Conversion rate is at 2.9% and still improving three months post-launch.”
“Our student-facing portal was a legacy application we were embarrassed to demo to enterprise clients. GYSP rebuilt it in Next.js — real-time updates, role-based access, SCORM compliance, API-first architecture. The new portal became a sales asset within a month. Two enterprise deals closed partly on the demo alone.”
“We needed three senior React engineers for a critical product milestone — immediately, not in three months. GYSP had three engineers in our sprint within nine business days. No ramp-up theatre. They were leading architecture discussions by the end of week one. We've extended their engagement three times since.”
“We had a six-month data engineering backlog and no realistic hiring path. GYSP embedded two senior engineers in under two weeks — deeply experienced in dbt, Snowflake, and Airflow — working inside our GitHub and Jira as if they'd been here for years. The backlog cleared in four months. They're still here.”
“We needed DevOps engineers who understood OT/IT convergence — not generalists who'd need six months to grasp the environment. GYSP matched us with two senior engineers with prior industrial experience. They were contributing to architecture decisions in week two. We retained both of them permanently six months later.”
“Our claims processing team was manually handling 900 documents a day. GYSP built an intelligent document pipeline — classification, extraction, validation — that now handles 72% of cases automatically. The remaining 28% arrive pre-annotated for our agents. Team capacity effectively doubled without a single new hire.”
“We were running seven tools that didn't talk to each other. GYSP mapped our entire operations workflow, removed the redundant steps, and built an automation layer using Make and a custom LLM agent for exception handling. Contract turnaround dropped from four days to under six hours. Operations overhead fell 43%.”
“We had 200 machines generating data that nobody was reading. GYSP built the IoT pipeline, real-time monitoring dashboards, and predictive maintenance models that flag failures 48–72 hours before they happen. Unplanned downtime is down 61% year-on-year. It has completely changed how our maintenance team makes decisions.”
“Industry 4.0 was a board priority but nobody could agree on where to start. GYSP assessed our entire value stream, identified the three highest-ROI digitisation opportunities, and delivered working solutions in ten weeks. The production visibility we have now has fundamentally changed how we allocate capacity across shifts.”
“Building patient-facing software that clinicians will actually use — while meeting HIPAA, HL7 FHIR, and our own security requirements — is genuinely difficult. GYSP got it right. Clinical staff adoption hit 76% in 90 days, which is extraordinary for new clinical software. The architecture held through a 4x patient load surge without degradation.”
“Scaling from an MVP to a HIPAA-compliant, SOC 2-ready platform felt like two separate projects happening at once. GYSP handled both simultaneously — encryption, audit logging, BAAs, penetration testing — while scaling our backend for 10x load. We passed our first enterprise security review without a single finding.”
“We had no real-time visibility across our warehouse network. GYSP built an end-to-end tracking system — inbound shipments to last-mile delivery — with live dashboards our ops team and clients can both see. Customer queries about shipment status dropped 67% in month one because the answer was already in front of them.”
“Our order management system was costing us enterprise clients. GYSP rebuilt the integration layer — WMS, carrier APIs, client systems — with automated exception handling and real-time SLA monitoring. Error rates fell from 4.1% to 0.2%. We've onboarded seven enterprise accounts in the six months since the rebuild.”
“We were spending half our engineering capacity fighting infrastructure fires. GYSP set up full observability, rewrote our on-call runbooks, and introduced error budgets that gave product and engineering a shared language for the first time. MTTR dropped from over three hours to 18 minutes. Engineering morale improved almost immediately.”
“We had a mobile app customers downloaded once and never reopened. GYSP rebuilt it from scratch — performance-first, personalised feed, one-tap reorder, a push strategy that actually respects the user. Day-30 retention went from 8% to 34%. Mobile channel revenue doubled in the first quarter post-launch.”
“Our legacy booking app was a consistent source of one-star reviews. GYSP redesigned and rebuilt it in React Native — offline mode, real-time inventory sync, a checkout flow that doesn't lose users. App Store rating went from 2.8 to 4.6 in four months. Booking conversion from search to confirmed reservation improved 31%.”
“We were managing a fleet data platform held together with scripts and manual interventions. GYSP modernised the entire stack — event-driven microservices on Kubernetes, real-time telemetry pipelines, a dealer-facing dashboard that actually works. Vehicle status query latency went from 12 seconds to under 400 milliseconds.”
Industries We Serve
Deep Domain Expertise
We speak your industry's language — compliance requirements, performance standards, and business pressures included.
Why GYSP
The GYSP Difference
Senior-Only Delivery Teams
Every engagement is staffed with senior engineers and architects — no juniors learning on your budget.
Outcome-Driven Engagements
We agree on measurable KPIs before we write a single line of code. If we don't hit them, we don't celebrate.
Flexible Partnership Model
We structure engagements around your goals and budget. Scale up or down as your needs evolve.
No Sales Pitch · Just Clarity
Get Your Free Technical Brief
Tell us what you're building or solving. We'll send you a tailored technical brief — architecture options, risk factors, and cost-saving opportunities — within 48 hours. No commitment required.
How it works
- 01Submit your challenge≈ 1 min
Describe what you're building or solving. The more context, the more useful the output.
- 02Receive your Technical BriefWithin 48h
Architecture options, timeline, team requirements, and cost-saving opportunities — from a senior engineer.
- 03Discovery call — no obligationOptional
Go deeper with the technical lead. No sales pitch, just problem-solving.